📷 Loveland Ski Area
North America
Loveland Ski Area
Pre-season — not open yet
Projected to open November 8, 2026
Conditions data updated Tue, Jul 14, 07:04 AM UTC · informational only
Scroll for happiness
Closed for Season
Weather data is still collected for informational purposes.
Last Snowfall
--
Past 24 Hours
0cm
Past 48 Hours
0cm
Past 10 Days
0cm
14-Day Forecast
0cm
Snow Depth
--
Powder Days
6
2026–27 season
Overview
Loveland Ski Area is a ski resort in North America, United States, currently closed for the season (Projected to open November 8, 2026). Conditions last updated 2026-07-14 07:04 UTC.
Resort Guide
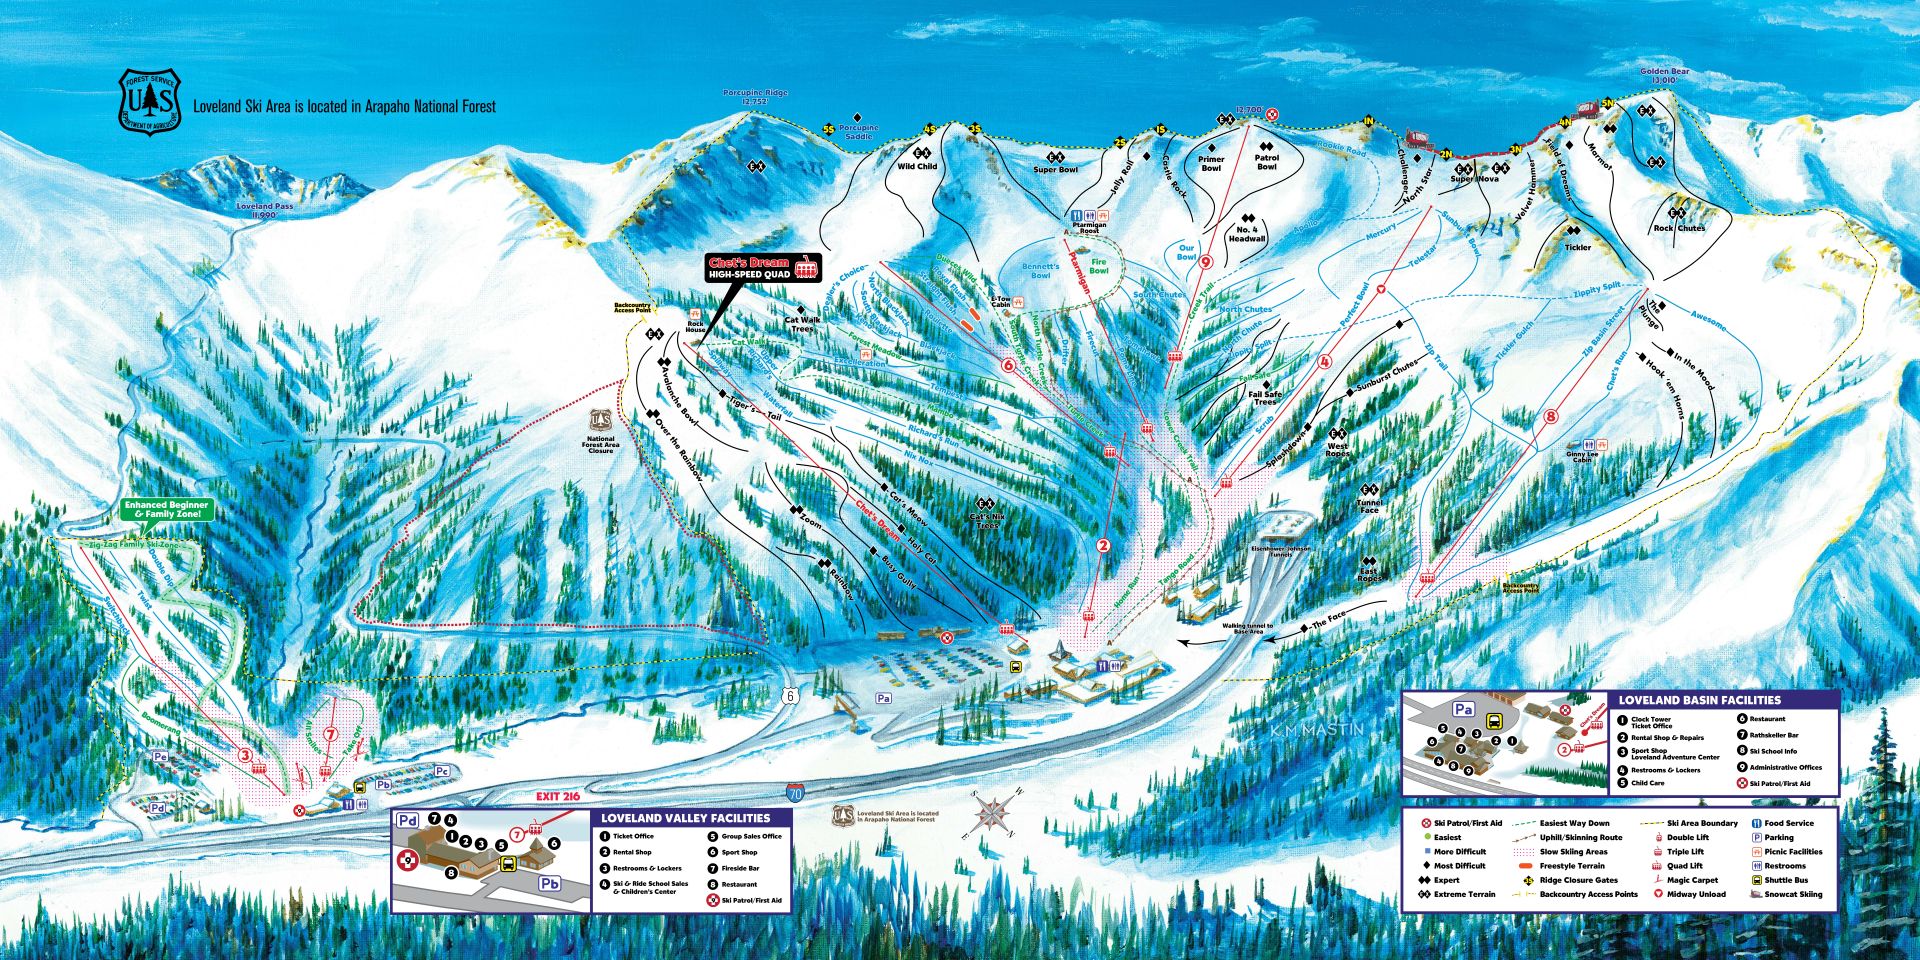
Loveland Ski Area is located near Georgetown, Colorado, just east of the Eisenhower Tunnel, offering over 1,800 acres of skiable terrain and an average annual snowfall of 422 inches. The resort is known for its high elevation, varied terrain suitable for all abilities, and a laid-back, unpretentious atmosphere. Signature experiences include expansive bowl skiing, affordable lift tickets, and one of the longest seasons in Colorado, typically running from October to May. Key amenities include on-mountain dining, equipment rentals, ski and ride school, and convenient access from the Denver metro area.
Gallery
Click to expand • 5 total photos
Terrain & lifts
Resort-reported stats for Loveland Ski Area
Lifts
10
Skiable area
1800 ac
Longest run
3.2 km / 2 mi
Runs by difficulty(94 total)
Beginner
12
13% of terrain
Intermediate
43
46% of terrain
Advanced
39
41% of terrain
Run counts estimated from resort-reported totals and terrain mix.
Lift fleet
- High-speed quad1
- Quad chair3
- Triple chair3
- Double chair2
- Surface lift2
Resort Info
Season dates
Future dates are operator estimates and may change.
Ski passes
Indy Pass
Powder Alliance
Access tiers change by season — confirm benefits on the pass operator's site.
Top Après Ski
Loveland Basin Cafeteria & Bar – Known for its laid-back, welcoming atmosphere, this slopeside bar is a favorite among locals and visitors for après-ski drinks, offering panoramic mountain views and a cozy spot to unwind after a day on the slopes.
Snow Summary
Updated Jul 14, 2026 at 7:04 AM
Historical data from Open-Meteo archive • Forecast from ECMWF IFS model
Snowfall Forecast Maps
Rockies & Southwest region
Current Conditions
Reported Tue, Jul 14, 07:04 AM UTC
Depth by source
every reading we have- SNOTELBase 0cm
The headline depth uses the most trusted available source. We show every reading so you can judge for yourself.
Base
3230m
Temp
10.6°C
Wind
8.2km/h
Snow Depth
--
14-Day Forecast
0cm
Mid-Mountain
3551m
Temp
--°C
Wind
9km/h
Snow Depth
--
14-Day Forecast
0cm
Summit
3871m
Temp
6.5°C
Wind
8.2km/h
Snow Depth
--
14-Day Forecast
0cm
Getting There
Road Conditions
3 sensors nearby
No restrictions
No active chain controls or restrictions on the highways near this resort right now (CDOT). Always re-check before a winter drive.
Roadside weather sensors
I-70 216.60 Eastbound : 0.4 mile East of US-6 Loveland Pass
1.6 km · CDOTAbove freezing
- Road surface
- 16°C
- Wind
- 0 km/h
- Precip
- no precipitation
Updated 7:54 AM
I-70 213.20 Eastbound : 0.6 mile West of Eisenhower Johnson Memorial Tunnel
3.9 km · CDOTAbove freezing
- Air
- 12°C
- Wind
- 13 km/h
- Precip
- no precipitation
Updated 7:54 AM
I-70 218.15 Westbound : 0.3 mile West of Herman Gulch Road
4 km · CDOTAbove freezing
- Road surface
- 14°C
- Air
- 11°C
- Wind
- 8 km/h
- Precip
- other
Updated 7:53 AM
Live highway sensors & cameras within ~30–40 km, via CDOT. Conditions on the drive, not the mountain — the resort's own road status is authoritative. Always re-check before a winter drive.
Local Reports
0 reportsDaily Snowfall Forecast by Model
Black line = verified SnowSure™ blend (not a simple average). Weights update weekly from measured snowfall at SNOTEL stations and resort reports.
SnowSure™ blend — verified model weighting
The black line is not a simple average. For Loveland Ski Area (rockies), we combine seven global weather models using weights learned from daily forecast verification — comparing each model's prediction to measured snowfall (SNOTEL, resort reports, ERA5).
- 1.Horizon buckets: days 1–3, 4–7, and 8–14 each get separate weights — short-range skill differs from long-range.
- 2.Regional calibration: weights come from verified error in this geography (Rockies, Alps, Japan, etc.), recalculated weekly.
- 3.Ground truth only: we never grade a forecast against another model — only against measured snow.
Building verification history for this resort.
How we verify forecasts →Hourly Forecast Detail
AM / PM / Night breakdown with wind and freezing level
NWP models refresh up to 4× daily · Last synced Jul 14, 7:04 AM
Today 19 / 40.3mm | Wed, Jul 15 19 / 40.3mm | Thu, Jul 16 17 / 34.5mm | Fri, Jul 17 17 / 40.9mm | Sat, Jul 18 19 / 40.9mm | Sun, Jul 19 20 / 45.9mm | |||||||||||||
|---|---|---|---|---|---|---|---|---|---|---|---|---|---|---|---|---|---|---|
| Period | AM | PM | Night | AM | PM | Night | AM | PM | Night | AM | PM | Night | AM | PM | Night | AM | PM | Night |
| Snow (cm) | 0 | 0 | 0 | 0 | 0 | 0 | 0 | 0 | 0 | 0 | 0 | 0 | 0 | 0 | 0 | 0 | 0 | 0 |
| Precip (mm) | 0 | 0.2 | 0.1 | 0 | 0.2 | 0.1 | 0 | 3.1 | 1.4 | 0.2 | 0.7 | 0 | 0.2 | 0.6 | 0.1 | 0 | 4.5 | 1.4 |
| Temp (°C) | 12 | 18 | 8 | 11 | 18 | 8 | 10 | 16 | 6 | 10 | 17 | 8 | 11 | 18 | 8 | 12 | 18 | 8 |
| Wind (km/h) | 4 | 11 | 9 | 6 | 10 | 10 | 5 | 8 | 6 | 2 | 7 | 7 | 4 | 4 | 5 | 2 | 5 | 4 |
| Gusts (km/h) | 17 | 37 | 27 | 22 | 38 | 31 | 19 | 34 | 24 | 27 | 45 | 29 | 29 | 46 | 32 | 26 | 36 | 32 |
14-Day Snow Forecast by Model
Summit elevation (3871m)
10-Day Forecast
Today
14
🌧️
18.8°
4.1°
13 km/h
Wed
15
🌧️
18.6°
3.5°
16 km/h
Thu
16
🌧️
17.3°
3.1°
13 km/h
Fri
17
🌧️
17.4°
3.5°
10 km/h
Sat
18
🌧️
19.1°
4.1°
9 km/h
Sun
19
🌧️
19.5°
3.7°
8 km/h
Mon
20
🌧️
18.2°
4.6°
12 km/h
Tue
21
🌧️
15.7°
3.4°
11 km/h
Wed
22
🌧️
15.5°
2.9°
15 km/h
Thu
23
🌧️
13.9°
1.9°
10 km/h
Summit elevation (3871m) • ECMWF model
Season vs Historic
Updated Tue, Jul 14, 07:04 AM UTC
0cm
Season Total
This Season to Date
—
vs 5-Year Avg
Off-season · 220cm full-season avg
—
vs 30-Year Avg
Off-season · 220cm full-season avg
220cm
5-Yr Avg by Now
Over the past five years, average seasonal snowfall has been significantly higher than the 30-year average, indicating an upward trend in recent snowfall. The most recent seasons have consistently exceeded the long-term norm, with the 5-year average at 197.3 cm compared to the 30-year average of 165.1 cm. Despite this overall increase, the current season's snowfall is notably lower than both the recent 5-year and long-term averages, representing only 76% and 91% of those benchmarks, respectively. This suggests a recent decline following several years of above-average snowfall.
Loveland Ski Area Snow History
Average annual snowfall is 308cm with an average of 137 snowfall days per season. The table below shows monthly averages across 30 seasons of archive data (modeled snowpack at mid-elevation).
| Month | Avg Snowfall | Snowfall Days | Avg Base Depth | Max Base Depth | Biggest Snowfall |
|---|---|---|---|---|---|
| November | 30cm | 14 days | 14cm | 26cm | 7.5cm |
| December | 34cm | 17 days | 32cm | 45cm | 7.4cm |
| January | 35.6cm | 17 days | 52cm | 66cm | 7.2cm |
| February | 36.4cm | 18 days | 68cm | 82cm | 6.9cm |
| March | 42.1cm | 18 days | 78cm | 93cm | 8.8cm |
| April | 52.6cm | 18 days | 82cm | 99cm | 10.8cm |
| May | 34.1cm | 14 days | 60cm | 90cm | 10cm |
Source: SnowSure archive · Open-Meteo ERA5 reanalysis at mid-elevation. Depth is modeled, not resort-reported.
Season at a Glance
Next season(2026-27)
Opens Nov 8, 2026
Multi-season averages will appear once SnowSure has tracked more than one full season.
Best Months to Visit
February
Peak Season
January
Peak Season
March
Good
December
Good
Note: Based on typical ski season patterns for this region.